
Thanks to advanced municipal technology, you no longer have to spend hours waiting at local government offices just to pull a parcel plat or analyze land use restrictions. By leveraging county Geographic Information Systems (GIS) platforms, anyone can instantly access deep spatial data directly from their web browser. Whether you are a tech savvy buyer evaluating raw land investments, an agent verifying a residential listing, or a developer examining local easements, mastering an online interactive parcel map is an indispensable skill.
These spatial hubs compile complex engineering layers, local tax data, and public zoning codes into a single, visual interface. This comprehensive guide details exactly how to navigate California’s modern GIS portals to streamline your property due diligence.
The Technology: What is a California County GIS Map?
A county GIS portal is not just a standard satellite map like Google Earth; it is a highly advanced, data-driven database. These networks overlay specific geographic dimensions with legal real estate classifications maintained by local municipal recorders and tax assessors.
Visualizing Lot Boundaries and Encroachments
The primary feature of a property GIS framework is its detailed rendering of lot boundaries. By rendering exact survey coordinate lines directly onto high-resolution aerial photography, the map allows you to visually audit the physical boundaries of a parcel. This makes it simple to cross-reference current fences, unpermitted outbuildings, or neighboring driveways against official county plat lines to detect potential encroachments before entering escrow.
Mining Spatial Data Overlays
Beyond basic property boundary lines, GIS systems host vast libraries of environmental and structural spatial data. Users can toggle specific visual filters on and off to evaluate critical land attributes, including:
- Official FEMA flood zone boundaries.
- State-mapped Alquist-Priolo earthquake fault zones.
- Localized landslide risk layers and wildfire hazard zones.
- Historical fire perimeters and topographic contour lines.
Technical Comparison of Major Southern California GIS Systems
While most California municipalities utilize Esri-backed ArcGIS technology, the user interface and structural tools can vary significantly from one county to the next.
| County Jurisdiction | Primary Public GIS Tool | Key Features for Property Research |
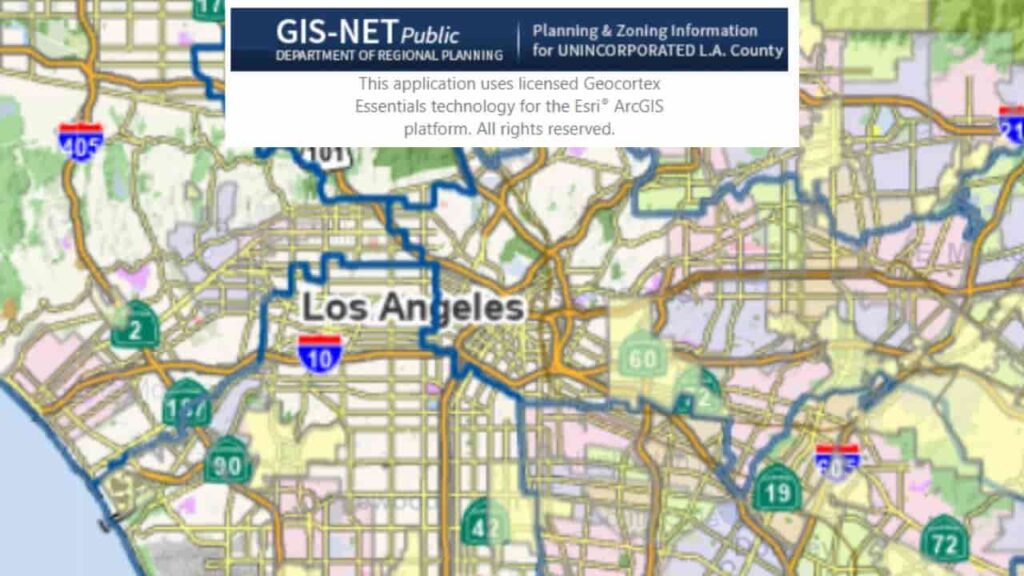
| Los Angeles County | LA County Portal / GIS-NET | Excellent zoning searches for unincorporated areas; includes historical aerial imagery timelines and detailed school district boundaries. |
| San Diego County | SanGIS Interactive Map | Provides free, downloadable raw GIS shapefiles; exceptional tracking of regional environmental conservation boundaries. |
| San Bernardino County | Public Assessor Map / ARC | Streamlined for quick parcel access; directly bridges spatial property shapes with live tax assessment rolls and land descriptions. |
Step by Step Tutorial: Navigating a California GIS Interface
To execute an advanced property and zoning search using an official municipal mapping portal, follow this standardized step-by-step framework.
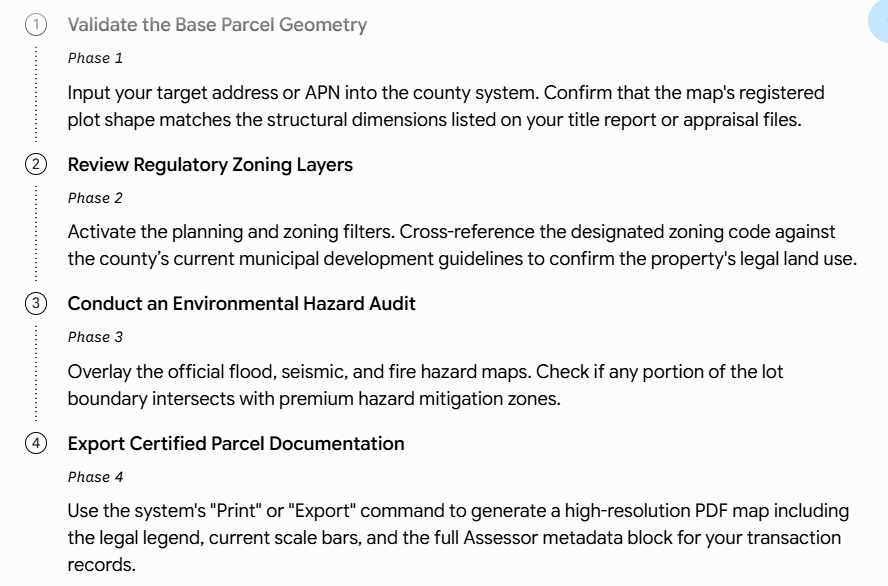
Step 1: Initialize the Target Parcel Query
To pull up a specific real estate parcel, you must first feed the interactive engine accurate location parameters.
- Open the target county’s official GIS webpage (e.g., LA County Assessor Map Search or San Bernardino County Assessor GIS Dashboard). Use Chrome or Firefox for optimal stability.
- Locate the main search panel. You can query the map by entering either the physical property address or its specific Assessor’s Parcel Number (APN). If you do not know the APN, use the map’s manual zoom tool to navigate directly to the physical street location.
Step 2: Analyze Lot Boundaries and Dimension Scale Bars
Once the portal locates the parcel, the system will highlight the target plot on your screen.
- Zoom in until the individual lot lines snap into sharp view. You will see a solid boundary polygon outline enclosing the property.
- Check the on-screen metadata window. This popup typically provides the total acreage, raw square footage, and recorded lot dimensions.
- Use the system’s interactive Measure Tool (usually indicated by a small ruler icon) to manually measure the linear distance from the home’s structure to the edge of the street curb to check physical setbacks.
Step 3: Execute a Zoning Search and Environmental Audit
To determine what can legally be built on the land or to check for hidden zoning liabilities, you must look into the layer menu.
- Locate the map’s Layer List panel (typically found on the right-hand sidebar or represented by a icon resembling stacked paper sheets).
- Toggle on the Zoning layer. The map will immediately color-code the entire area based on its municipal code classification (e.g., R-1 for Single-Family Residential, C-3 for Commercial, or A-1 for Agricultural land use).
- Scroll further down the layer index and activate the Environmental Hazards submenu. Turn on the FEMA Special Flood Hazard Areas and Wildland-Urban Interface (WUI) filters to confirm if the property requires mandatory hazard insurance additions.
Strategic Verification Blueprint for Property Researchers
To maximize your research efficiency and prevent missing critical structural disclosures when analyzing California parcels, implement this systematic execution sequence:
Advisory Note: While California county GIS maps for property research provide highly accurate data for daily due diligence, these visual interfaces are officially compiled from multiple disparate survey sources. They are designed for informational planning purposes only. A GIS map layout cannot legally replace a formal, stamped boundary survey conducted on-site by a licensed California Professional Land Surveyor (PLS).
Conclusion
Navigating California county GIS maps for property research allows real estate professionals to extract precise spatial data without administrative friction. By mastering an interactive parcel map, you can instantly cross-reference legal lot boundaries, identify physical encroachments, and complete a comprehensive zoning search across major jurisdictions like Los Angeles, San Diego, and San Bernardino. Integrating these digital Geographic Information Systems tools into your standard investment pipeline guarantees that critical environmental hazards, municipal utility setbacks, and strict land-use constraints are thoroughly verified before you jeopardize capital or enter a formal escrow agreement.
FAQs
How do I find California county GIS maps for property research?
Visit your specific county assessor or planning portal and locate their public interactive parcel map or geographic data dashboard link.
Can I check exact property lot boundaries on a GIS map?
Yes. GIS portals overlay official municipal survey lines onto high-resolution aerial imagery, showing clear property lines and lot boundaries.
What kind of spatial data can I find on a California GIS map?
You can toggle layer filters to analyze environmental spatial data, including FEMA flood zones, seismic faults, and wildfire hazards.
How do I run a land zoning search using GIS maps?
Open the map layer menu, turn on the planning/zoning overlay, and match the parcel’s color code to its municipal land-use classification.
Why do different California counties have different GIS map interfaces?
While most utilize standard Esri ArcGIS architecture, individual county IT departments customize their specific layouts, tools, and public access permissions independently.
Can I look up a property on a GIS map without an APN?
Yes. Most modern interfaces allow you to search directly by a standard physical street address or by manually panning the interactive map view.
Are California county GIS maps completely accurate for boundary disputes?
No. GIS maps are excellent for preliminary research but cannot legally replace a physical survey conducted by a licensed California Professional Land Surveyor.
How can I measure building setbacks using an interactive parcel map?
Select the platform’s digital ruler or measure tool, click your starting point, and drag the line to calculate precise linear distances on-screen.
What should I do if a GIS map shows a fence crossing my line?
Secure a certified title report and hire a professional surveyor to confirm the physical line before addressing the encroachment legally.
Can I download raw spatial data files from California GIS portals?
Yes. Many advanced county networks allow users to export public parcel shapes as shapefiles or layer-backed PDFs for private planning software.